The Gedae Development Environment
Gedae's Development Environment simplifies the complexities of programming signal and data processing applications for multiprocessor and multi-core systems.
The Gedae Development Environment is fully featured and built on the foundational Gedae Idea Language and Compiler. Developers can specify the functionality of an application and map it to a hardware architecture in a fraction of the time previously required. Gedae automates the most complex and tedious parts of the development process to maximize productivity AND deliver performance matching or exceeding expertly hand optimized code.
With the Gedae Development Environment developer's can harness the enormous power of automation offered by the Gedae Idea Compiler. Developers observe the behavior of an application and adjust the processing mapping, interprocessor communications, granularity, buffering, memory mapping, thread management and executable structure.
Our development environment includes the new generation, easy to learn Gedae Idea language and compiler; and tools for analyzing data, implementation and execution.
Read more about the tools offered as part of the Gedae Development Environment Below.
PARTIONING AND MAPPING
With Gedae's Partitioning and Mapping Tools applications can then be easily partitioned and mapped to the hardware of your choosing.
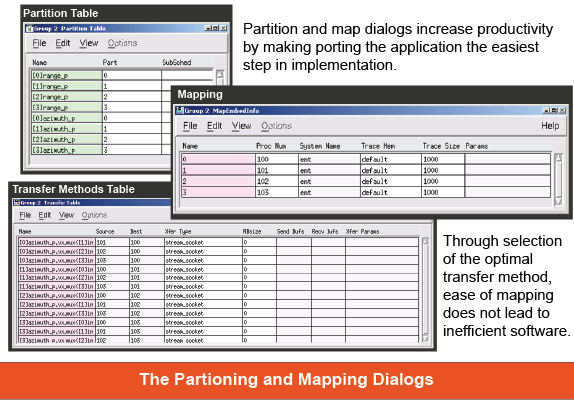
One of the most powerful features of Gedae is the ease of partitioning and mapping an application to run on multiple processing elements (not to mention repartitioning and remapping). By creating an application as a flow graph, it is easy and natural in Gedae to partition the graph into sections, and then map each of those sections to hardware. This act of partitioning the graph provides information to the Gedae compiler, which helps it plan the application’s threads and adjust for the distribution the developer has specified.
When a graph is ready to be distributed, the developer must first partition the graph. In the Partition Table, the developer is presented with a table listing all the components in the flow graph. The developer simply selects which components should be broken off into a new partition and assign them to a new partition name.
Mapping those partitions to target hardware is just as easy. In the Map Partition Table, the developer is presented with a table listing all the partitions he has just made in the Partition Table. For each partition, the developer selects the processor number the partition will be mapped to from a predefined list.
One would expect that an application so effortlessly mapped to hardware would perform basic, inefficient communication schemes, but Gedae is designed to not fall prey to such inefficiencies. Many transfer methods can be made available in Gedae, from DMA to shared memory to processor-specific protocols, and through the Transfer Table, the developer can easily select transfer methods for each communication. The transfer methods are fully parameterized, allowing for precise specification of buffer sizes and other parameters so that the most efficient transfer can be used.
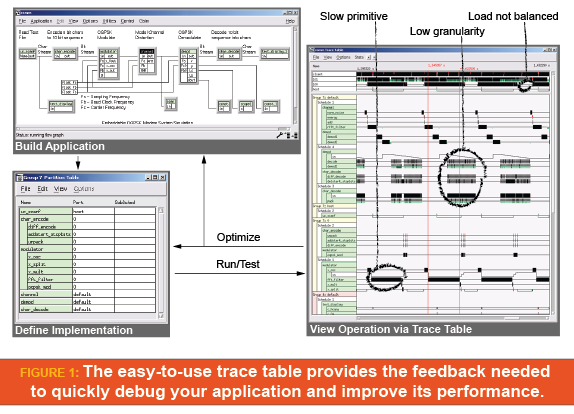
THE TRACE TABLE
Developing complicated high performance applications requires visibility into the execution of the process. The Gedae Trace Table provides this visibility by giving you the feedback you need to quickly debug your application and improve its performance.
Gedae collects trace information with low overhead in a circular buffer kept on each processor. Accurate clock synchronization between processors and nanosecond resolution allows you to correctly determine the causal relations between processors to quickly solve blocking problems that span processors.
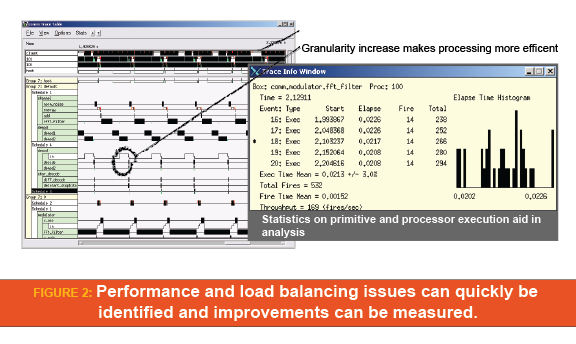
The Trace Table provides the information needed to optimize performance. A summary time-line for each processor allows load balancing decisions to be made, while time-lines for each primitive allow slow primitives or primitives needing a granularity increase to be easily identified. The ability to zoom and scroll through the timeliness and to collapse and reorder the location of hierarchical boxes in the Trace Table makes navigation of the Trace Table for large graphs easy. The timeliness gives you the information you need to choose the communication method that best meets throughput and latency requirements of your application. Once optimizations are implemented the graph can be rerun and improvements measured.
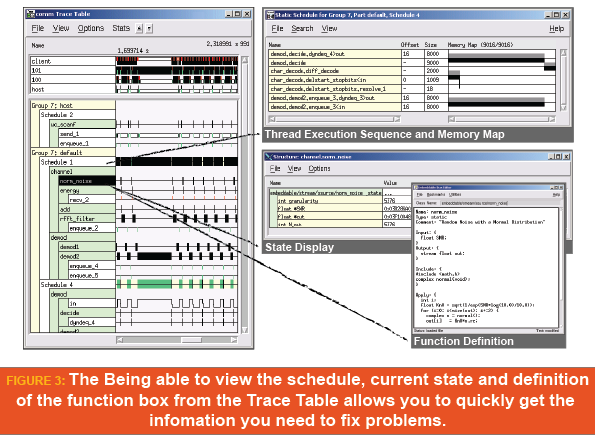
The Trace Table also provides detailed information about the workings of the Thread Scheduler. The ability to view schedule state transitions and queue availability gives you the information you need to detect and fix blocking and starvation problems common to all signal processing applications.
DEBUGGING
Gedae provides powerful tools for debugging your distributed software. Traditional debuggers only provide help for addressing the problems of programming a single thread on a single processor. Gedae’s tools have been designed to address the programming issues of a multi-threaded, multiprocessor application.
Debugging Dialog
The Debug Dialog provides a centralized control panel for debugging distributed software. Source code debuggers can be launched directly from the dialog for each processor element. Execution of individual threads can be stopped, single stepped, and restarted. Breakpoints can be set based on a variety of data flow events, including:
Data Flow Debugging
Gedae provides a comprehensive set of tools to help users detect and fix data flow problems. Using these tools, common distributed processing problems, such as blocking and starvation, can be understood and fixed. After Gedae indicates a data flow error in the distributed application, the Flattened Graph helps visualize the error condition. The Flattened Graph displays the full flow graph in one window and provides many methods for color coding primitives, arcs, and I/Os to help debug data flow issues. Many data flow problems can be visualized in the display, including issues encountered both inside a single thread and between distributed threads.
Probes
Coming soon!
Return to the PRODUCTS main page.